Bill Rankin, 2015
download:
.PNG (3000x6000, 3.4 MB)
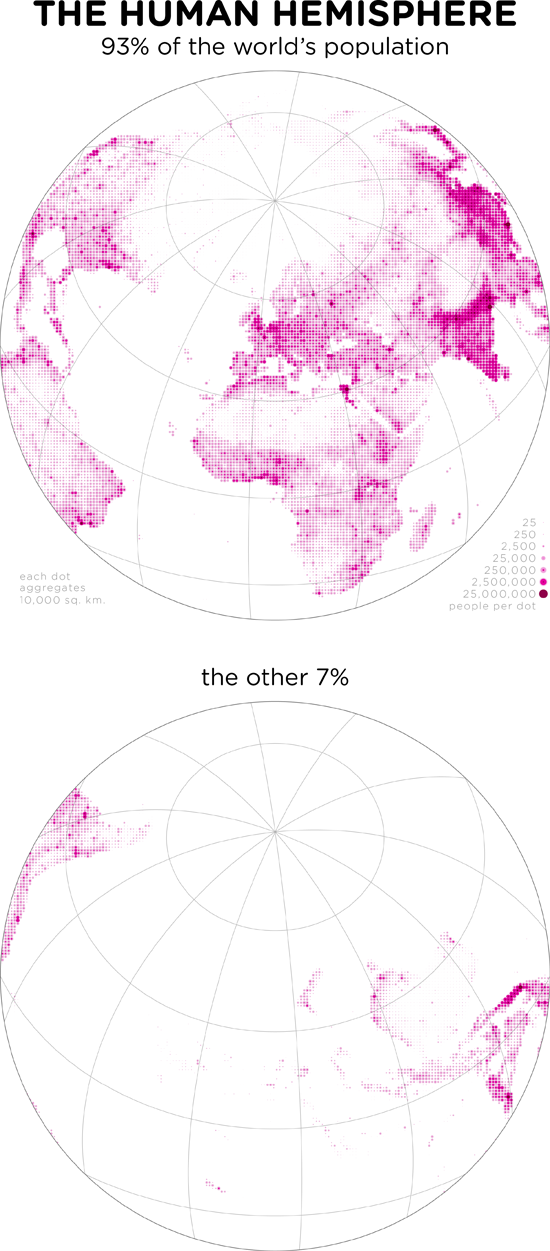
Just under 88 percent of humanity lives in the Northern Hemisphere; 82 percent lives in the Eastern Hemisphere. (And I have the graphs to prove it.) But of all of the infinitely many hemispheres that could divide the earth into two halves, which has the most people of all?
The hemisphere shown here — the Human Hemisphere — contained 92.9% of all humans in the year 2000, the most recent year with global data available. Its center is in western Switzerland, at roughly 46.5°N, 7°E. (A more exact value isn't possible, given the imprecision of population data from around the world.) Not surprisingly, the Human Hemisphere is not so different from the Land Hemisphere (the hemisphere with the most land); the main difference is that the Human Hemisphere contains more of Southeast Asia and less of South America. This is not the same as the so-called center of population, but it could still give some insight into things like airline hub-and-spoke patterns, satellite broadcasting, or the location of global financial centers.
So it looks like there might be some justification for Eurocentrism after all, at least geographically. Ah well.
Besides offering a fun new way to slice the world, these maps are also an attempt to show population density in a new way. Instead of shading land areas different colors, I use one dot for each 10,000 square kilometers and scale the visual impact of the dot according to population. Not only does this smooth over the jaunty edges of the raw data, but it gives equal visual emphasis to land areas and to highly populated islands, which are usually invisible on population maps. It also makes it much easier to show everything from the sparsely populated tundra to huge megacities on a single logarithmic scale.
Data from GRUMP, the Global Rural-Urban Mapping Project. Calculations done with ArcGIS; equal-area projections.
