Bill Rankin, 2009
download:
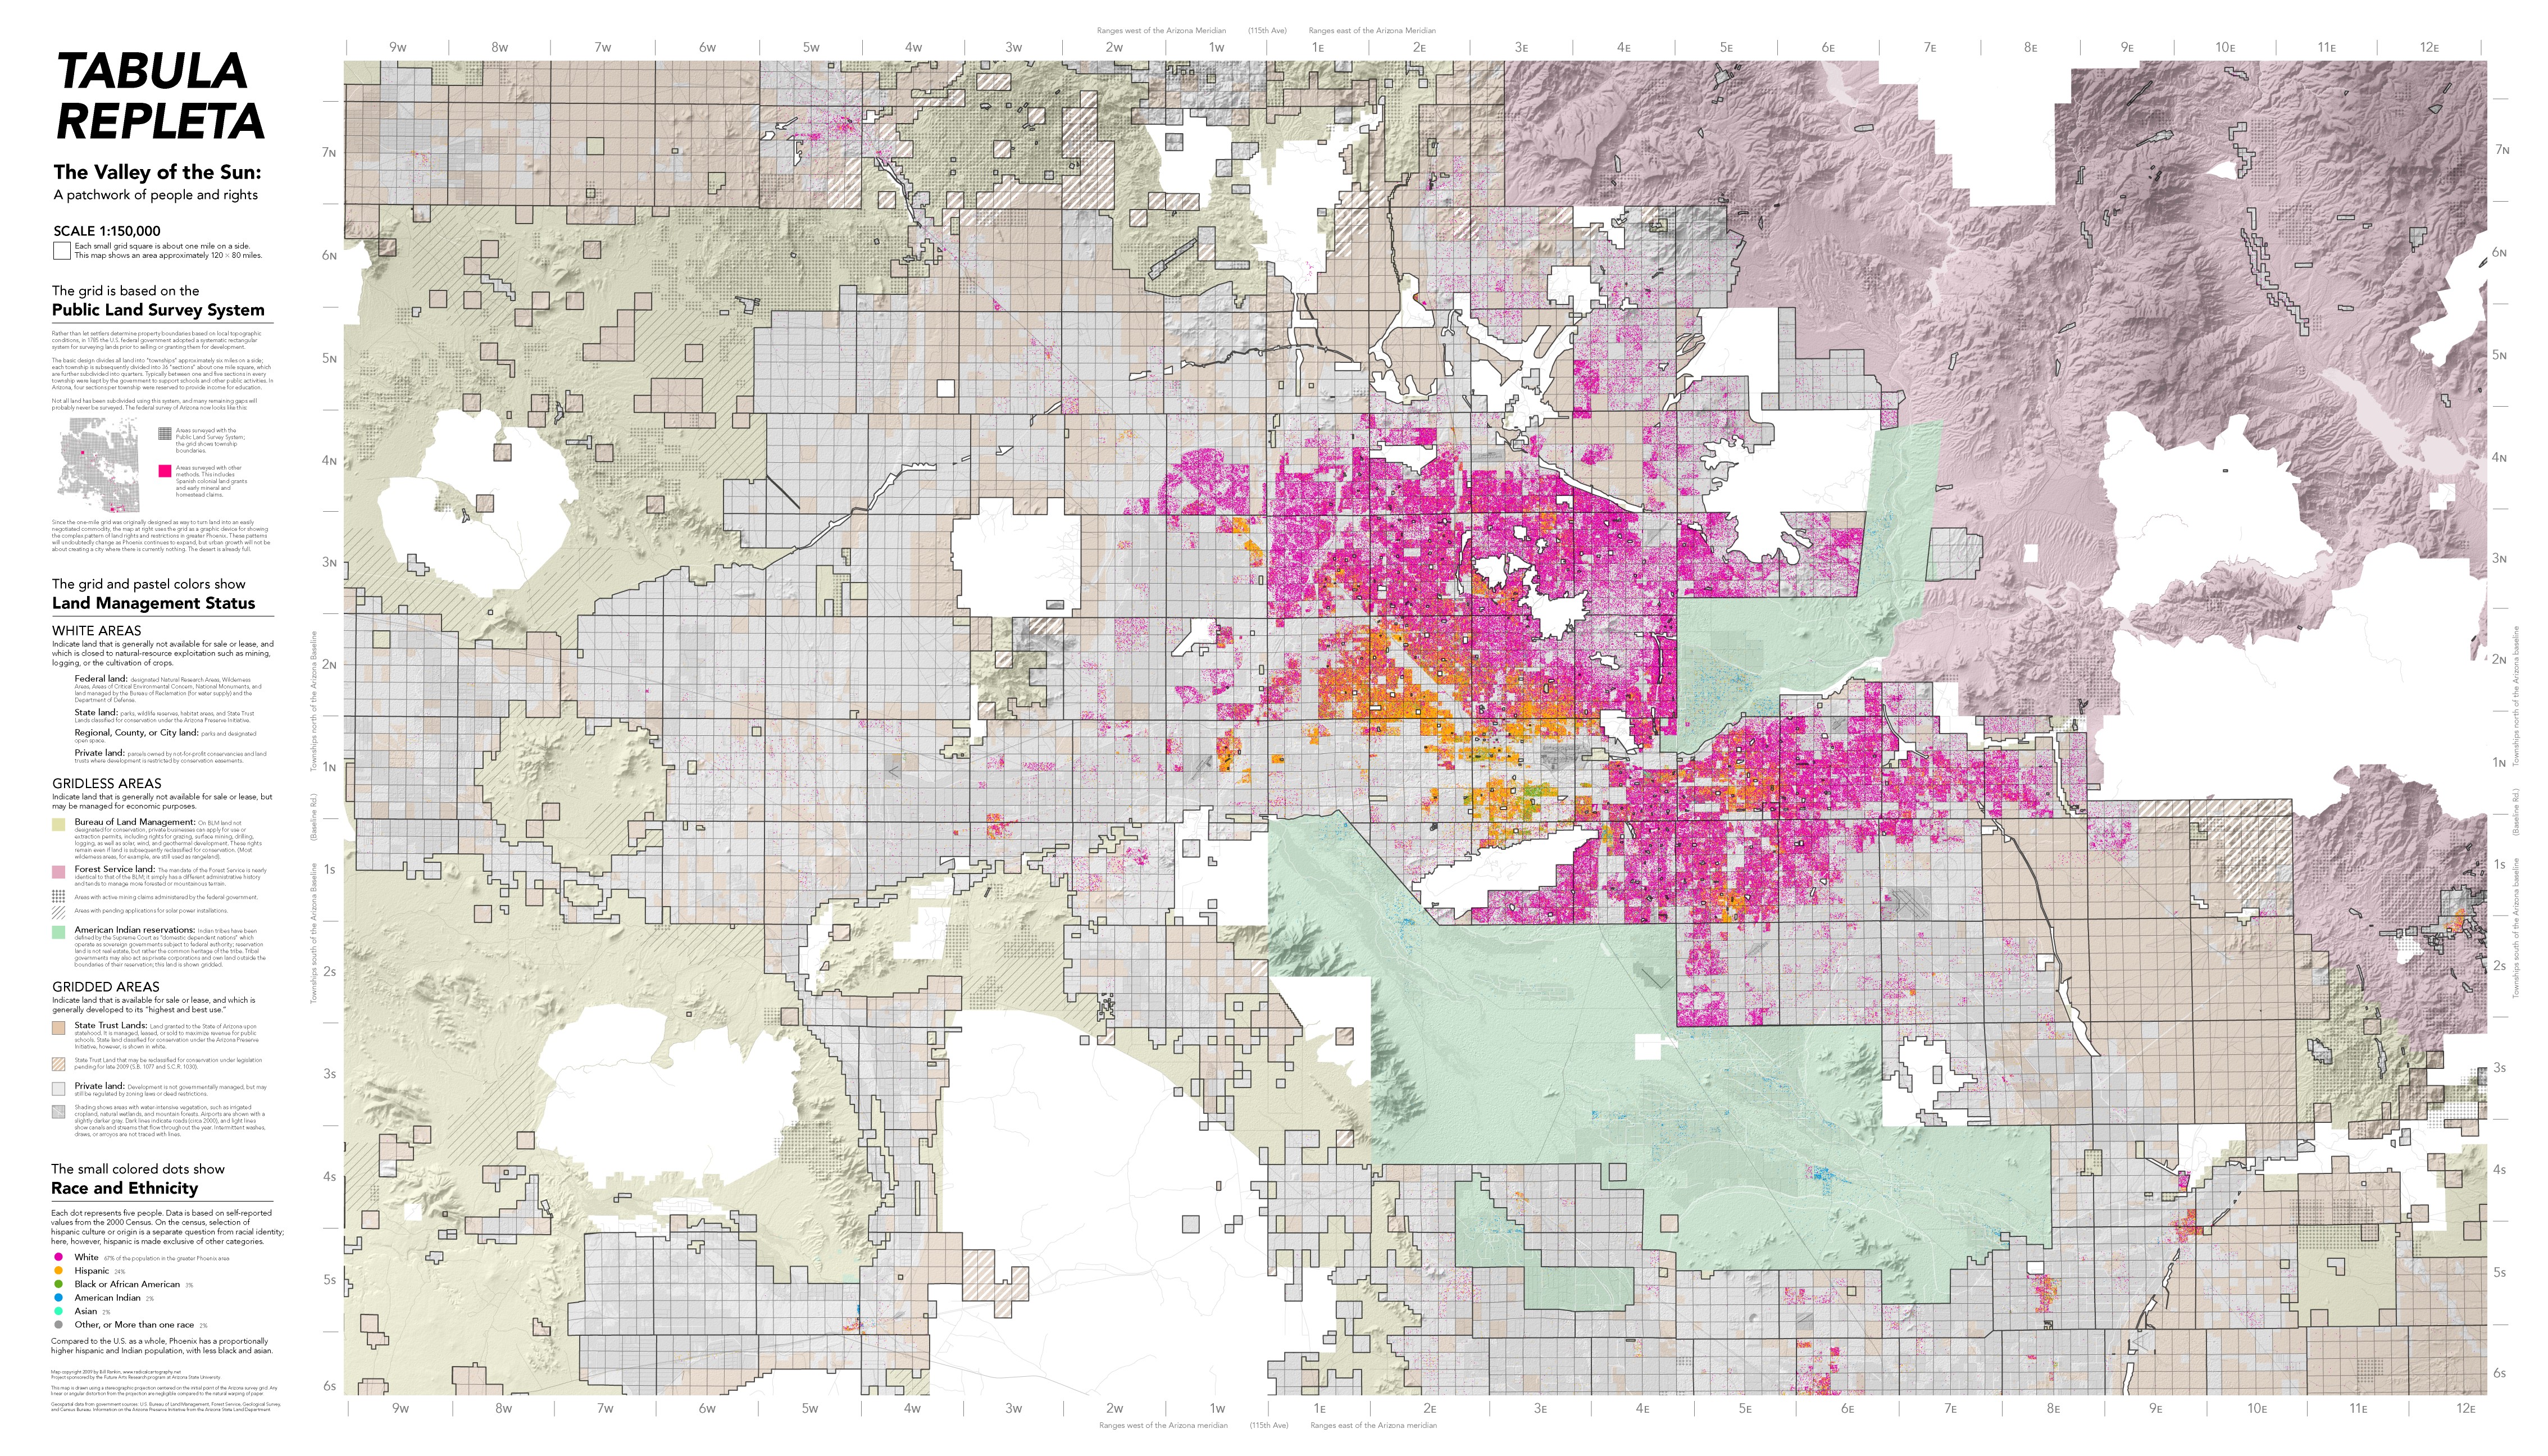
race (4500x2500 .JPG)
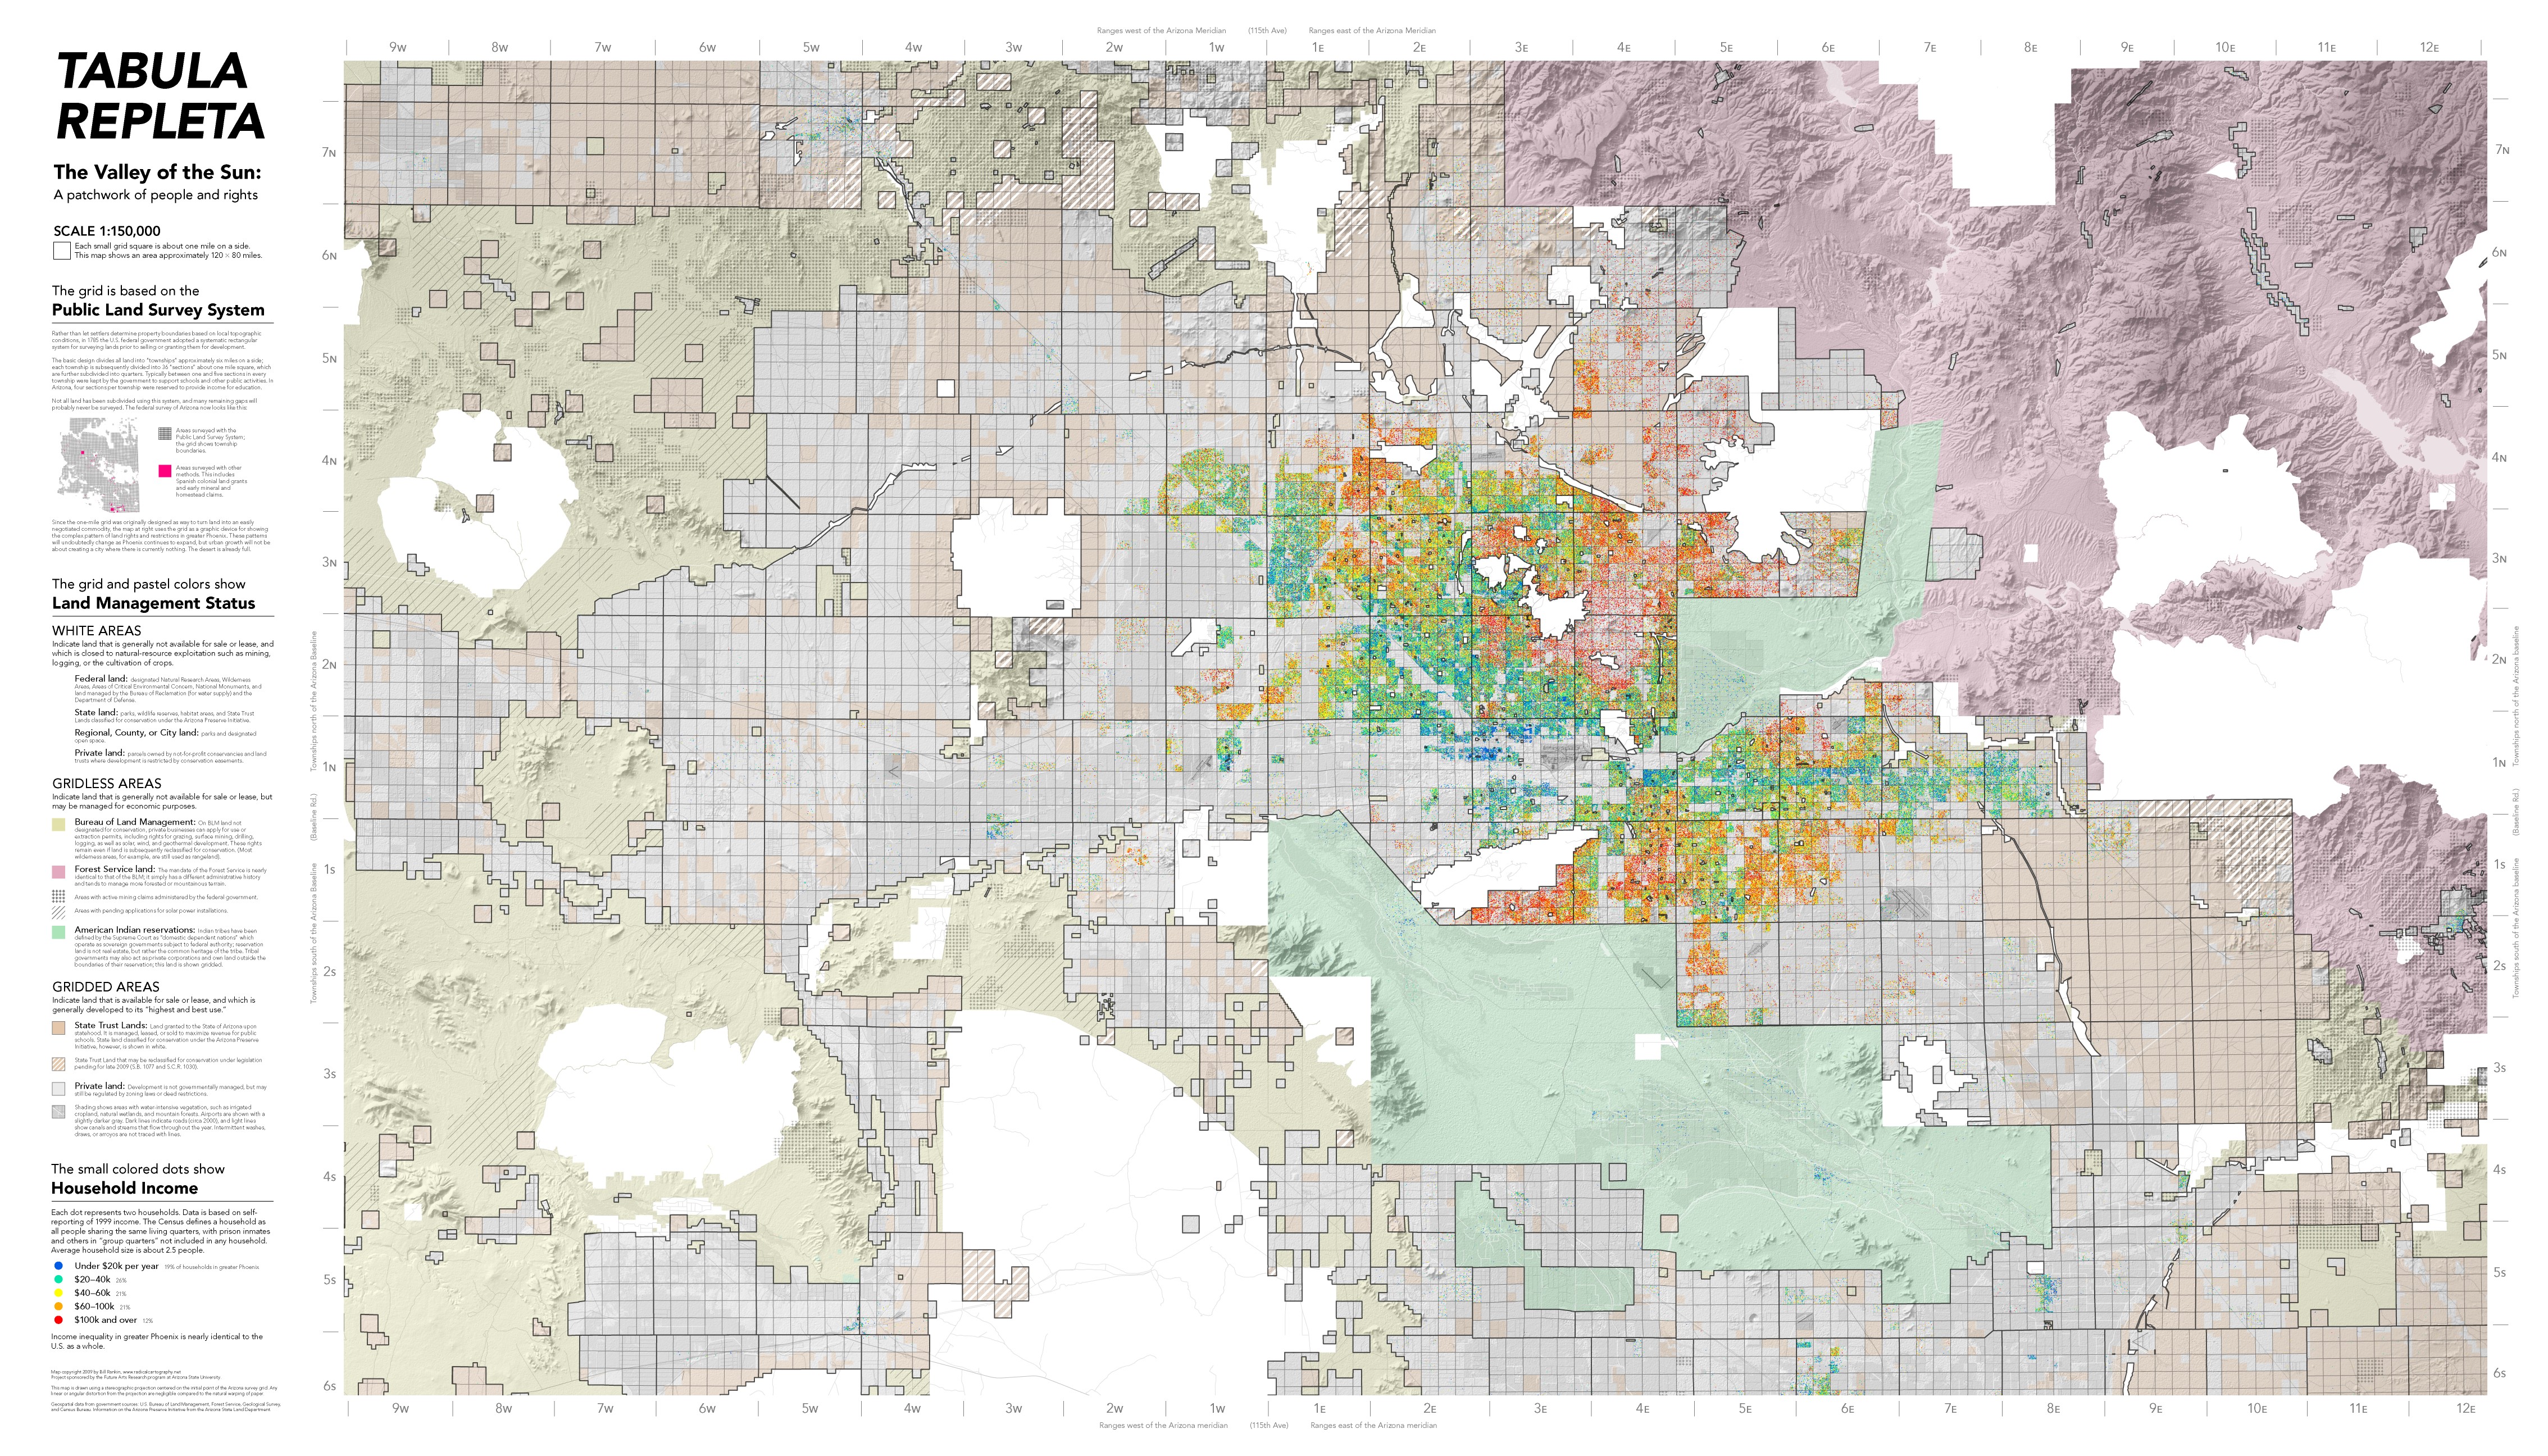
income (4500x2500 .JPG)
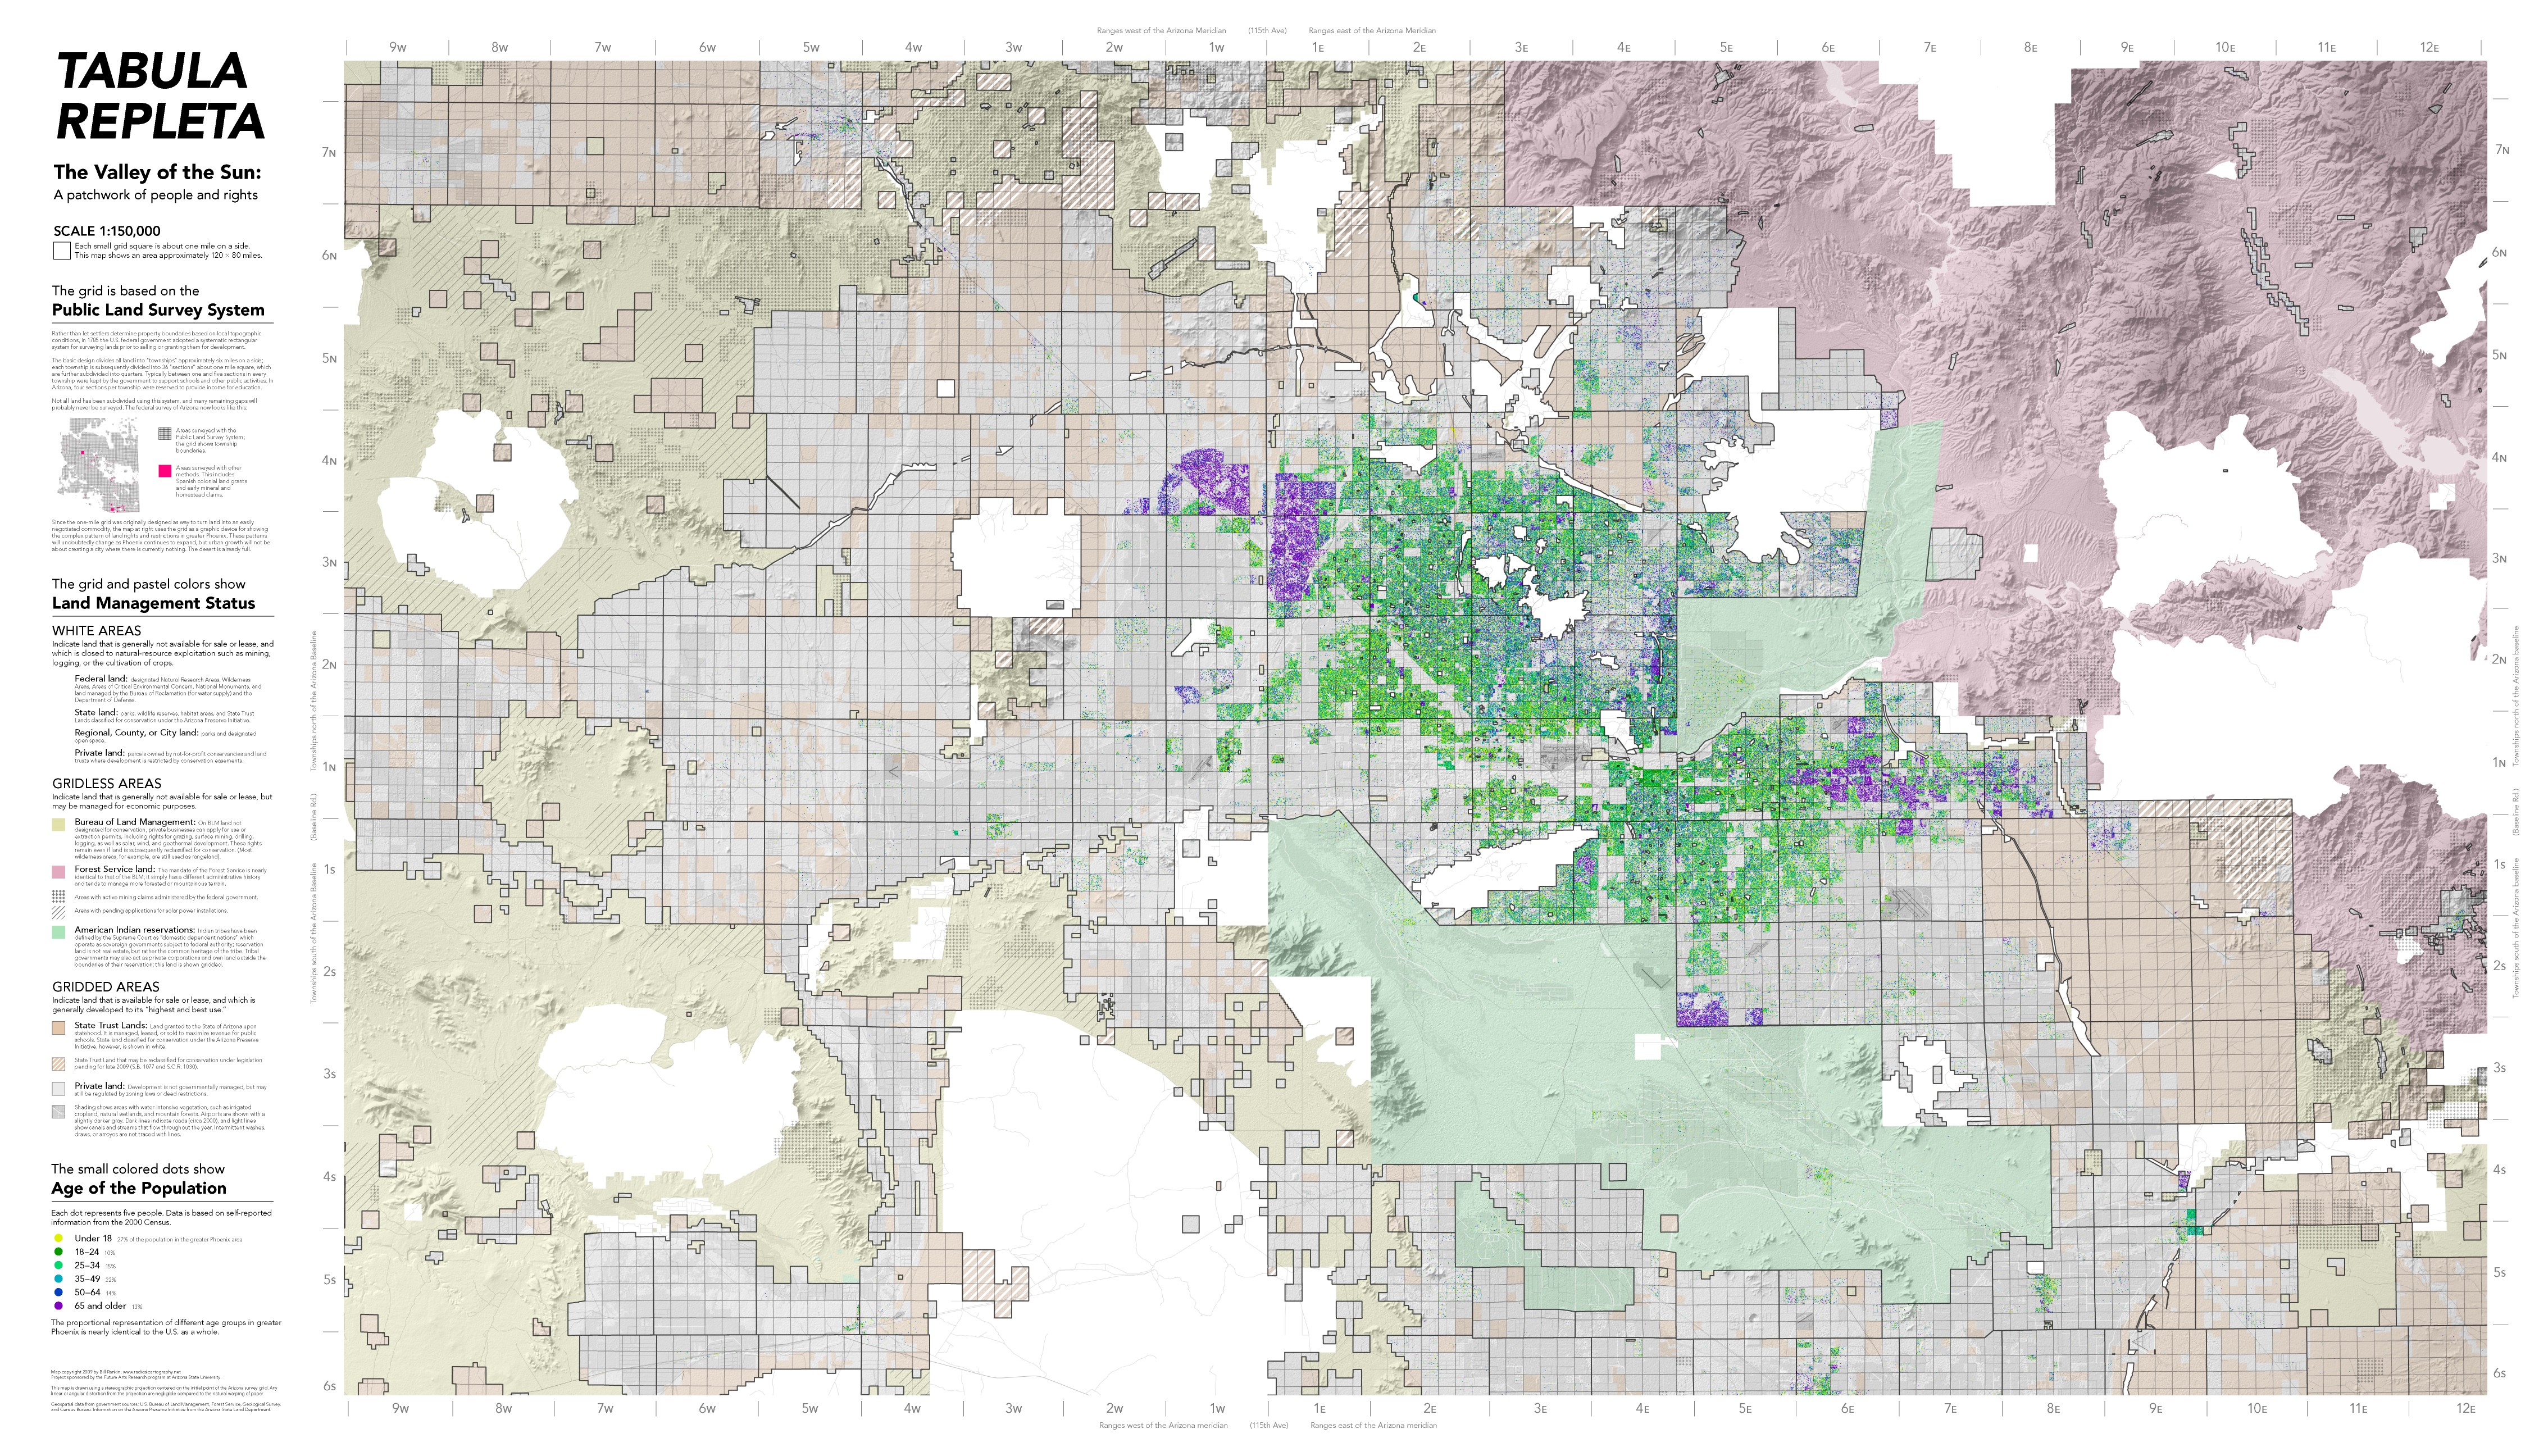
age (4500x2500 .JPG)
Rather than heap more attention on the conspicuous boundary between city and desert Ś with the city portrayed as a metastasizing blob expanding into a featureless tabula rasa Ś these maps focus on the internal boundaries within both city and desert. The result shows the desert as already quite full in a legal sense, and the city as a complex field of different kinds of segregation (mostly de facto, but in the case of age, sometimes de jure as well).
These maps bring together two of my longstanding graphic interests. First is to find new ways to show land management, sovereignty, and territory in order to challenge the assumptions of the traditional pastel patchwork of absolute sovereignty. Here I use a three-step system of gridded, gridless, and white areas to show restrictions on development; the grid provides a second layer of information beyond what can be shown with the pastel shading. Second, these maps show social statistics using hundreds of thousands of tiny dots, rather than using areas of solid color. Not only do dots show density at the same time as demographic data, but they focus our attention on areas of transition and diversity in ways that aren't possible when mapping one-dimensional metrics like median income or the percent prevalence of various racial groups.
Data from the USGS, BLM, USFS, Census, and State of Arizona.
This project sponsored by the Future Arts Research program at Arizona State University.
