Bill Rankin, 2011
download:
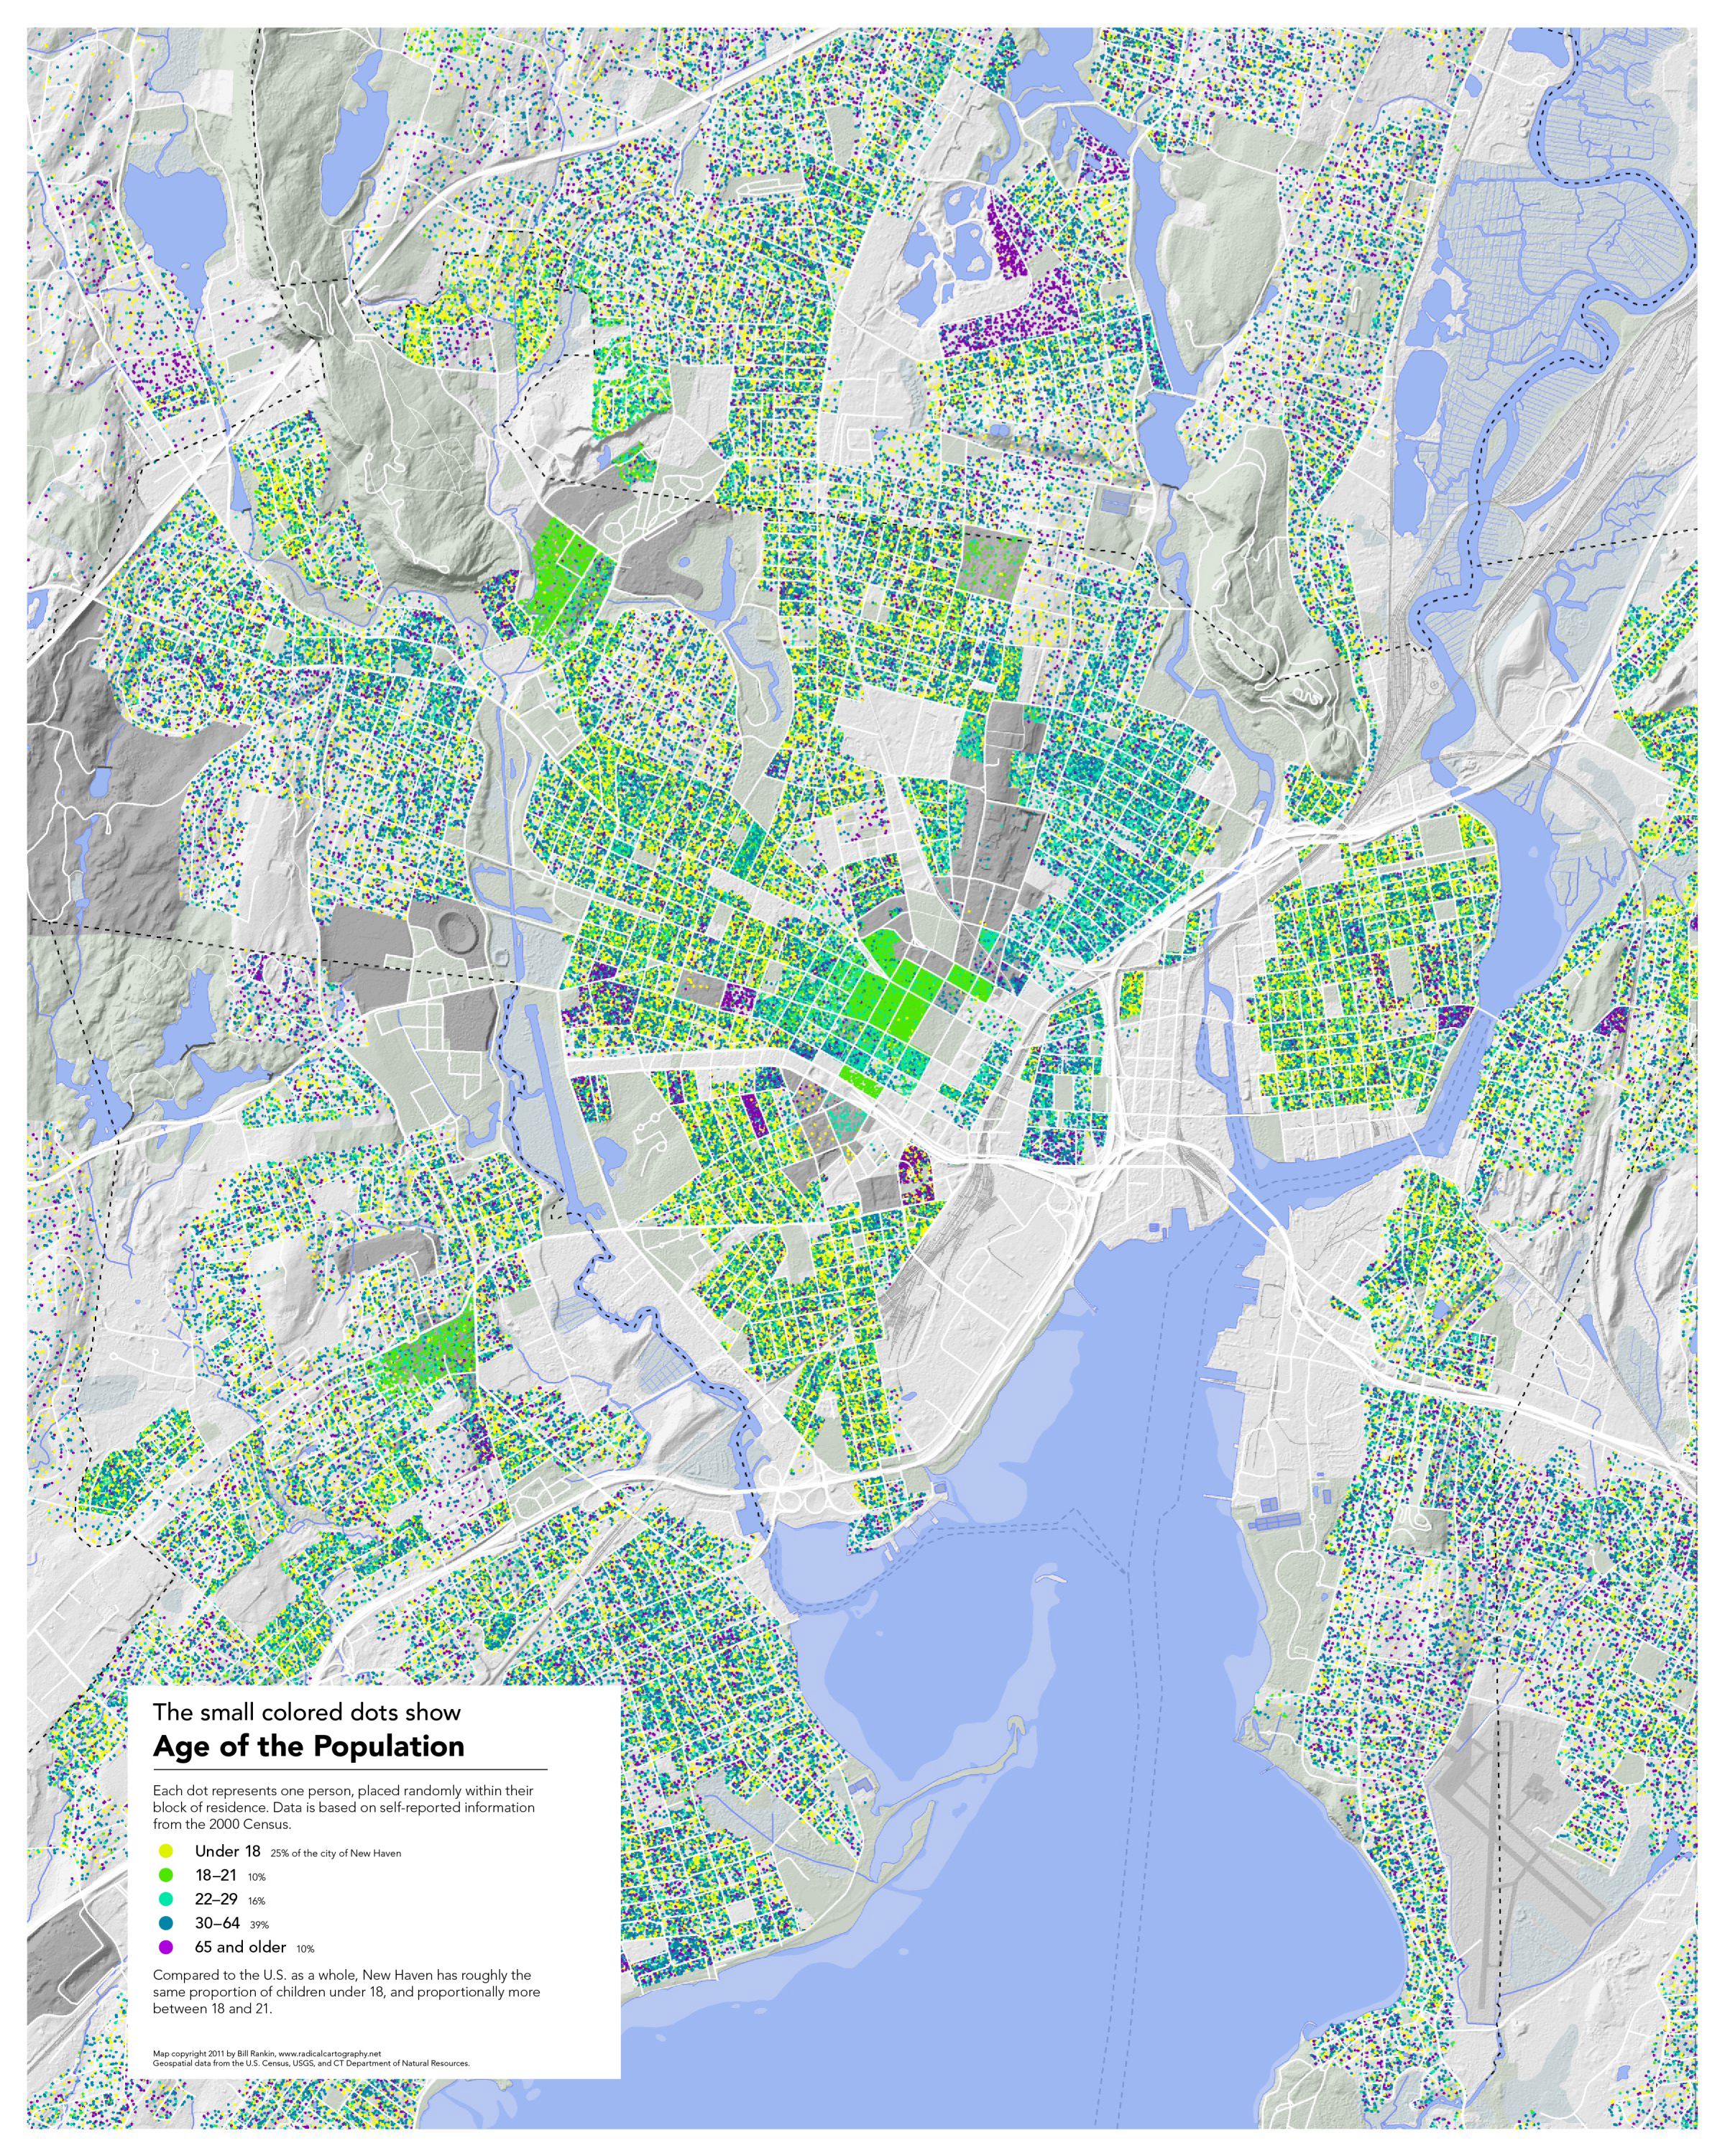
Age (2400x3000, 2.0 MB)
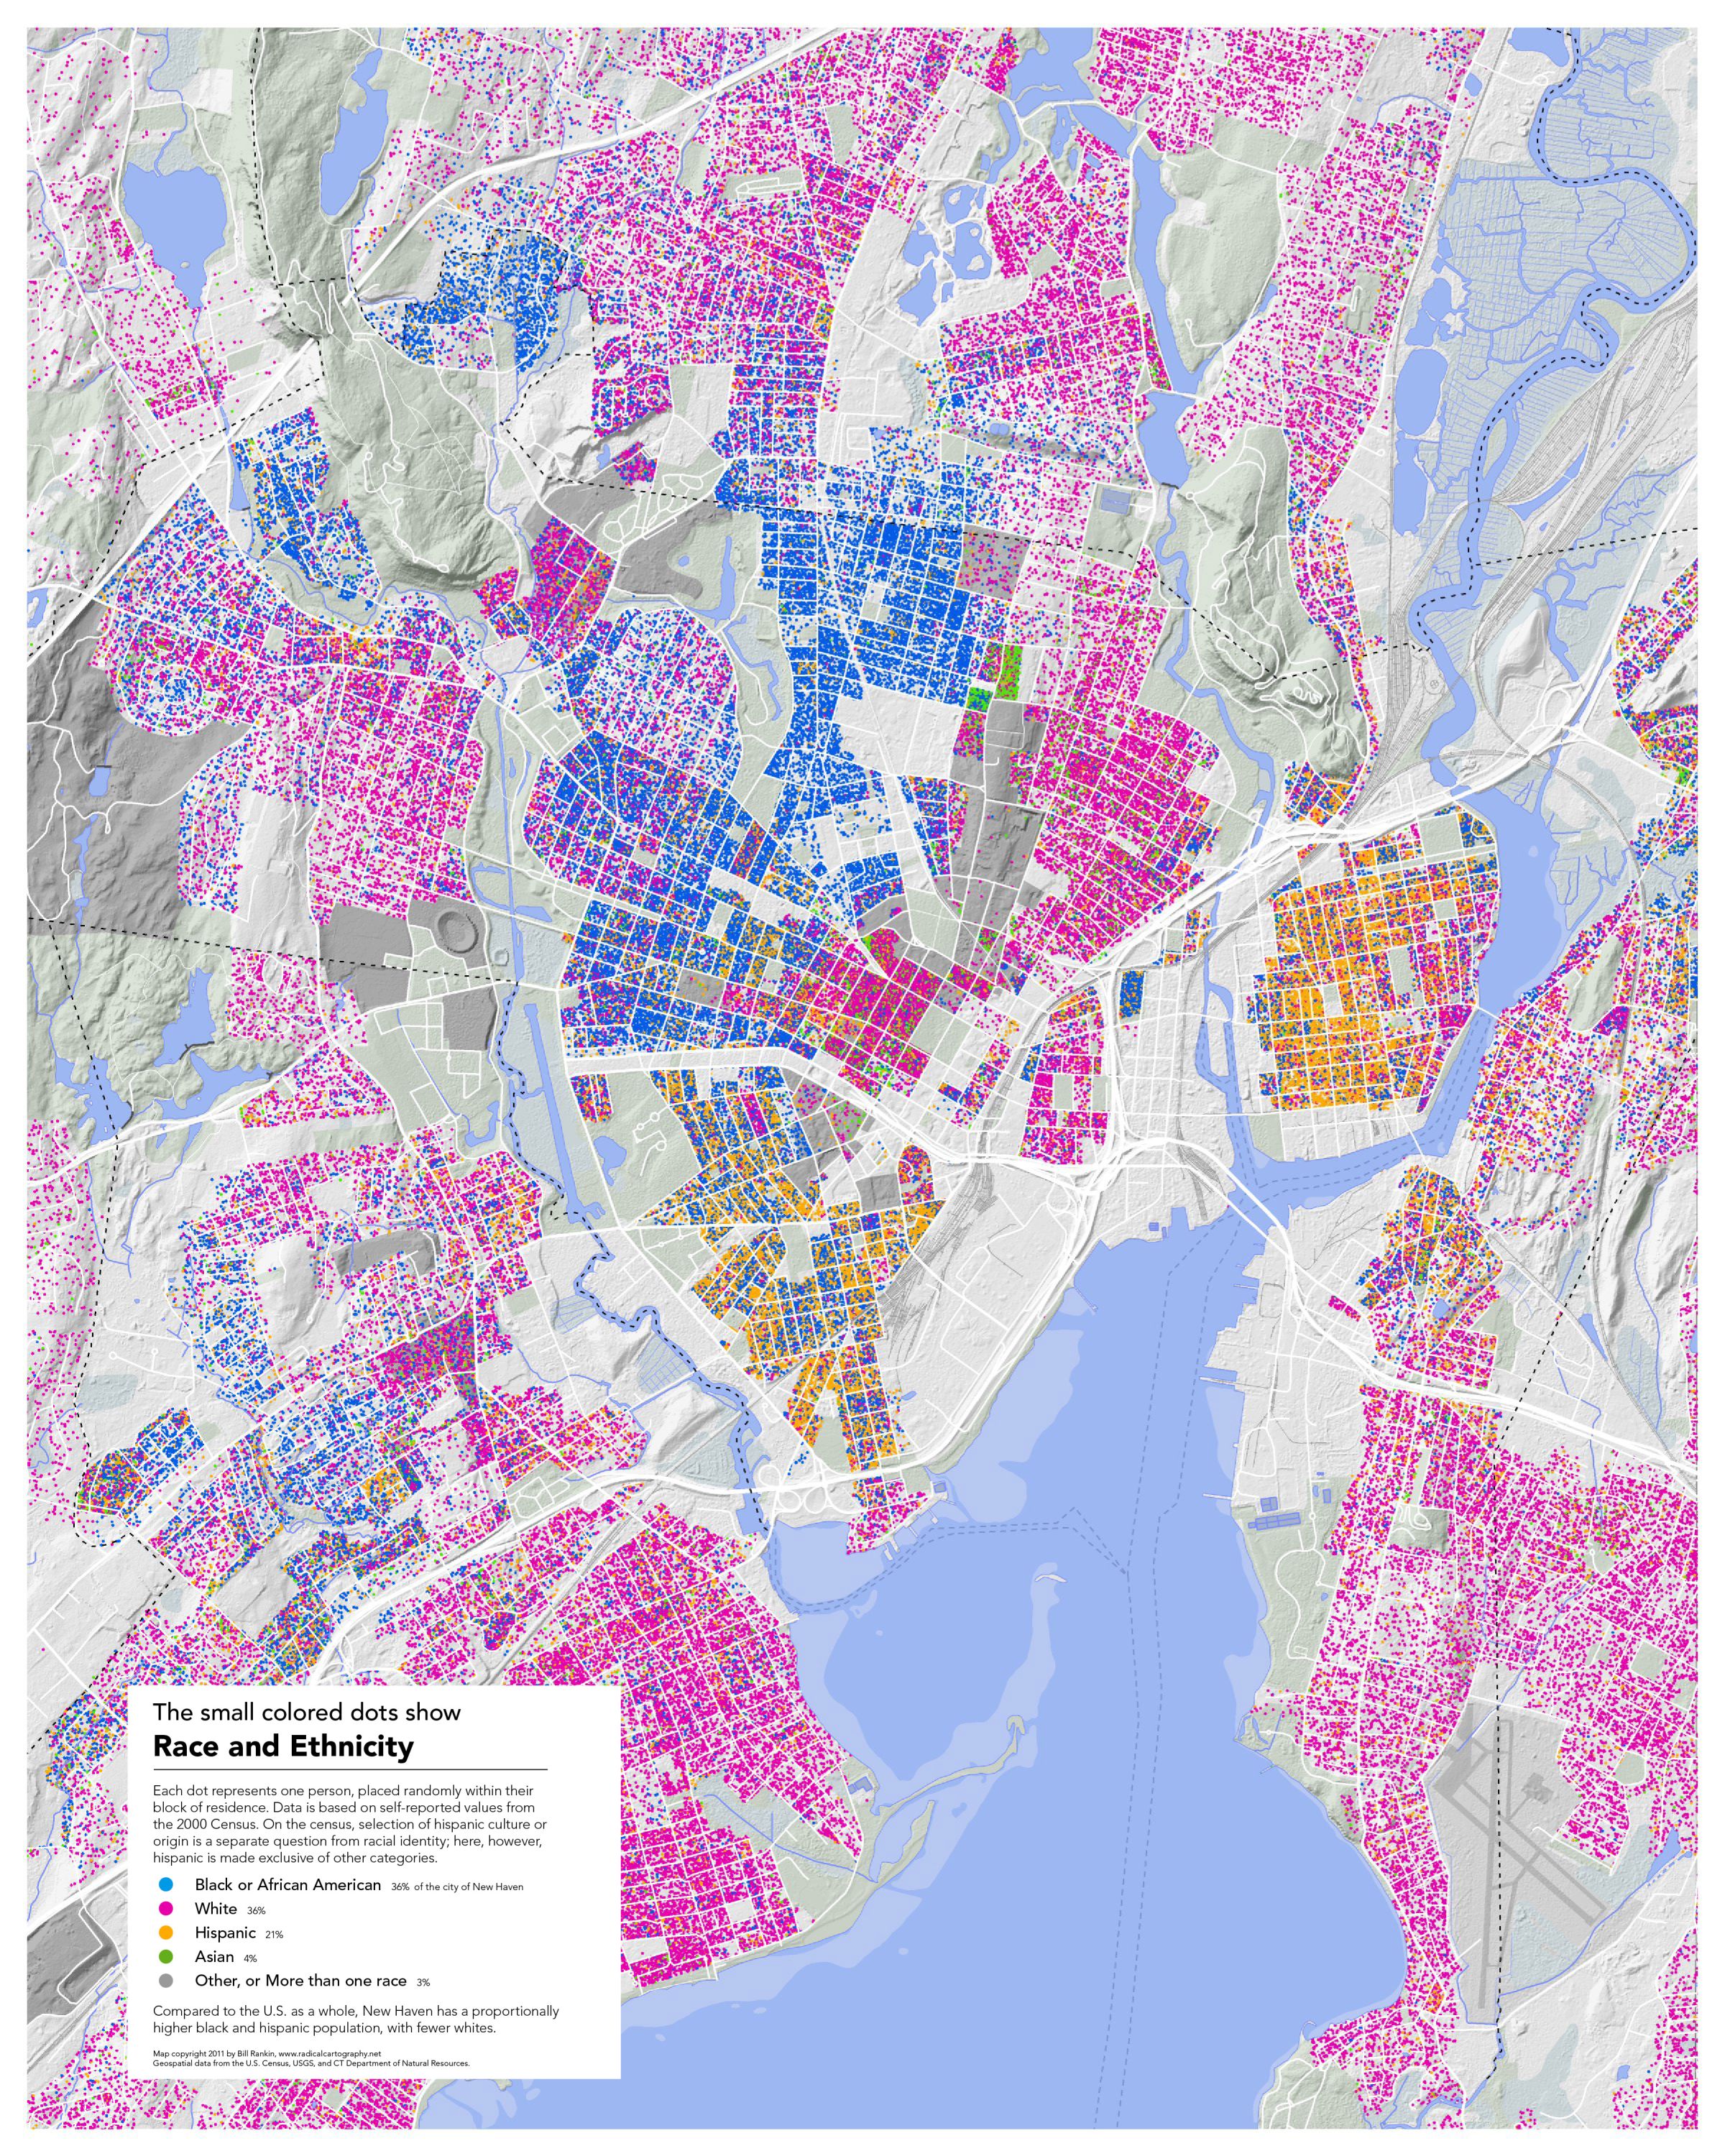
Race (2400x3000, 2.0 MB)
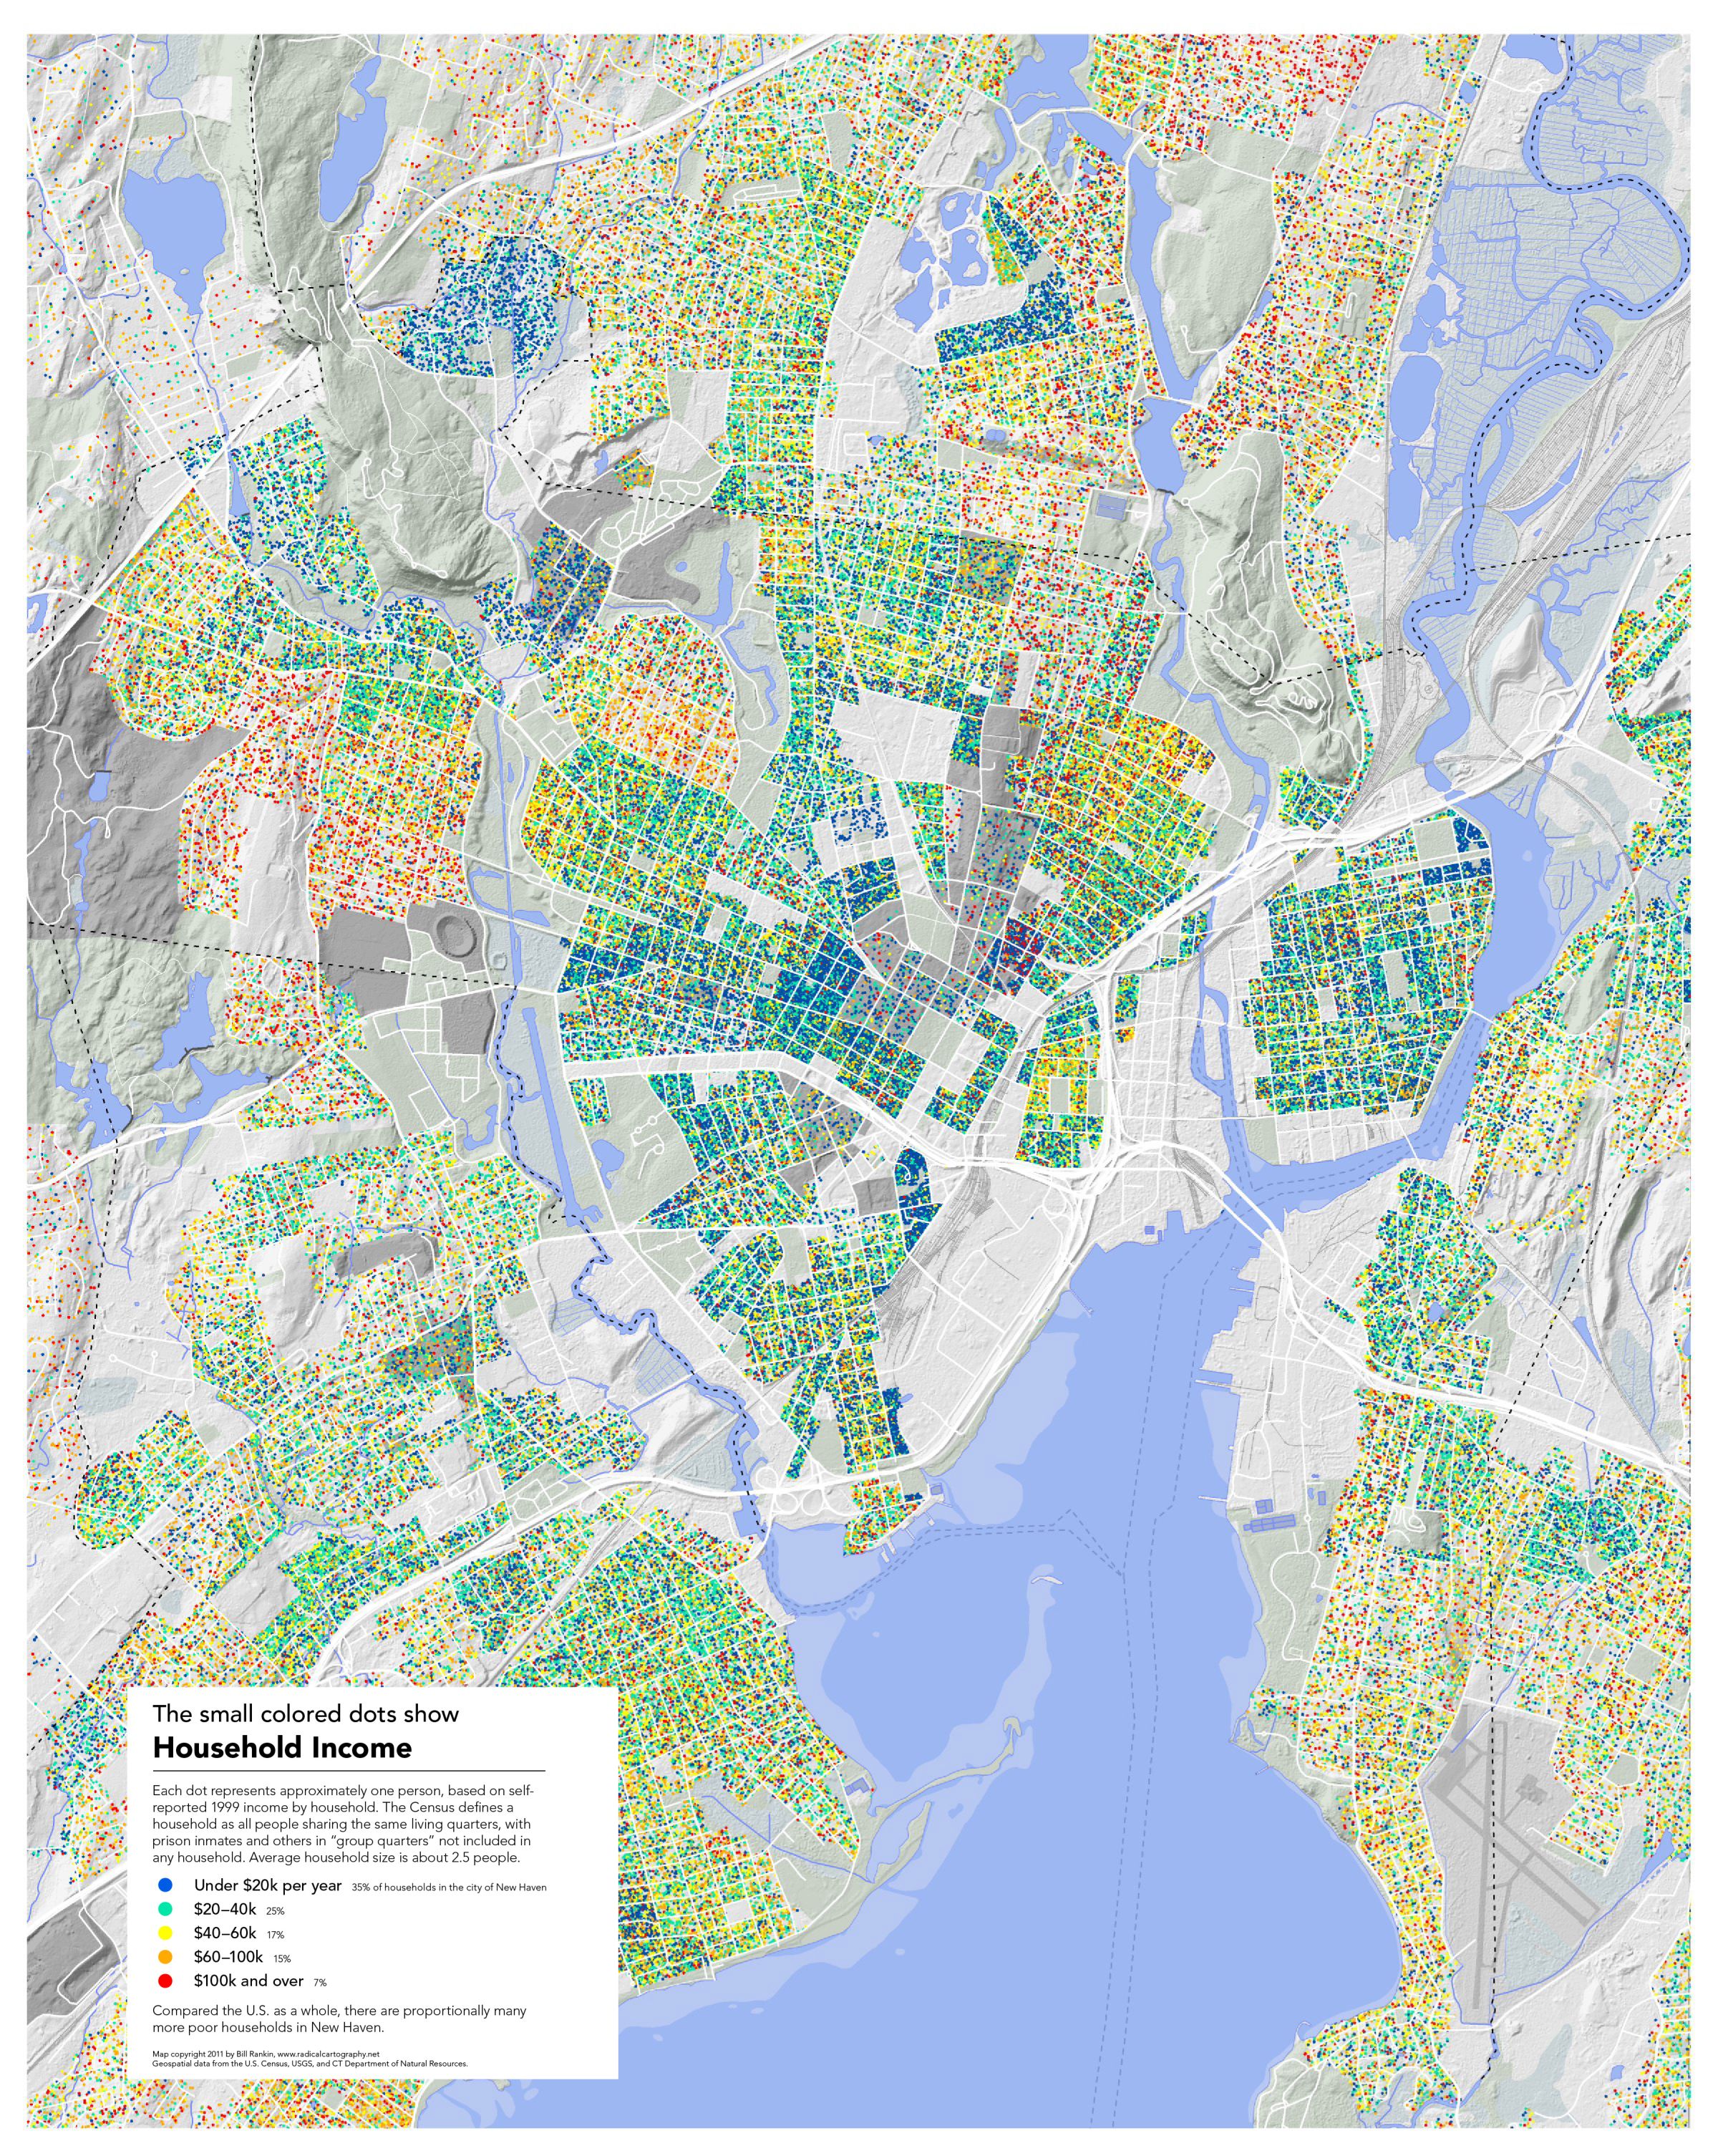
Income (2400x3000, 2.0 MB)
These maps are similar to the census dot maps I made of Chicago, Phoenix, and the Bay Area, but with one important difference — scale.
There are two kinds of scale that are relevant here. One is urban: New Haven has long been described as "a small city with big-city problems," and it's remarkable how the same extremes of segregation and inequality found in places like Chicago also characterize the much smaller city of New Haven. The other smallness is cartographic. In order to put dots in the right place and show accurate variations in population density, I had to pay much more attention to the details of topography, open space, and public institutions. At this scale, inequality doesn't just appear at the scale of neighborhoods or the boundary between city and suburbs; it also appears at the scale of individual blocks and the boundaries of college campuses, public housing, and senior-living developments.
All data from the US Census.
